Vanna & Charm: Advanced Options Flow

Second-order Greeks that drive VIX-sensitive market moves and end-of-week positioning flows — the forces behind some of the market's most puzzling price action

See Live Vanna & Charm Data →
What is Vanna?

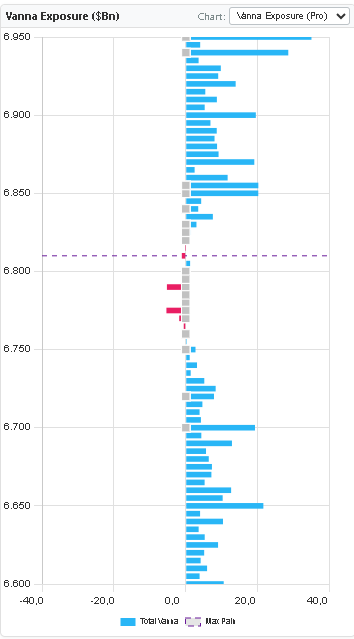
Vanna measures how much an option's delta changes when implied volatility (IV) changes. In mathematical terms: ∂Δ/∂σ — the partial derivative of delta with respect to volatility.

For market makers hedging their options books, Vanna creates a problem: when VIX moves (implied volatility changes), their delta changes even if price doesn't move. They must re-hedge — creating directional flows in the underlying that are entirely driven by volatility, not price action.

🌊 Vanna in plain terms

When VIX drops sharply (implied vol crushes), out-of-the-money call deltas increase. Dealers holding short calls must buy more of the underlying to re-hedge. This creates a vol-crush rally — price rises not because of bullish news, but because volatility falling forces mechanical buying. This is one of the most common "no catalyst" rallies in the market.

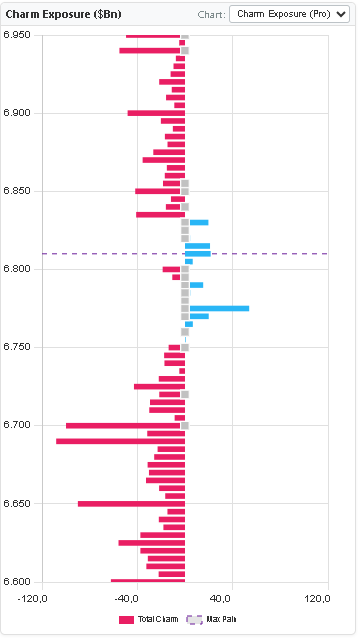
  • Positive Vanna flow: VIX drops → dealers buy the underlying → price rises
  • Negative Vanna flow: VIX spikes → dealers sell the underlying → price falls
  • Most powerful when large OTM option positions exist
  • Often explains "mystery rallies" after volatility compression
What is Charm?

Charm (also called delta decay) measures how much an option's delta changes as time passes. In mathematical terms: ∂Δ/∂t — the partial derivative of delta with respect to time.

Every day that passes changes the delta of every option — even if price and volatility don't move. For market makers, this means their hedge ratios change overnight, requiring them to buy or sell the underlying at the open of each new trading day.

⏱️ Charm in plain terms

Overnight, as time passes, out-of-the-money puts lose delta (their delta moves toward zero). Dealers who were short those puts (holding long underlying as hedge) now need less underlying to stay hedged. They sell the excess underlying at the open — creating systematic selling pressure early in the session, especially on Thursdays and Fridays as options approach expiration.

  • Charm flows are largest as options approach expiration (Thursday/Friday)
  • OTM puts losing charm = dealers sell their underlying hedge
  • OTM calls losing charm = dealers buy back their short underlying hedge
  • Creates systematic intraday directional patterns near OpEx
The Weekly Vanna-Charm Cycle: Why Markets Move When They Do

Understanding the weekly flow of Vanna and Charm helps explain patterns that repeat week after week — particularly around options expirations.

MON
New options positioning established

Fresh weekly options are sold/bought. Vanna and Charm exposures are low because expiration is far away. Market structure is relatively free from Vanna/Charm flow pressure.

TUE
WED
Vanna flows most active mid-week

Any VIX moves on Tuesday/Wednesday create significant Vanna-driven flows as OTM options still have meaningful delta sensitivity to vol. A VIX crush on Wednesday often triggers a Vanna-driven buying surge in ES/NQ. Watch for "no reason" rallies that come with falling VIX.

THU
Charm flows accelerate

With one day left to expiration (for weekly options), Charm is at its most powerful. Delta decay is rapid — overnight theta burn forces dealers to rebalance at the Thursday open. Often creates directional pressure in the first 1-2 hours of Thursday's session. The direction depends on whether calls or puts dominate open interest.

FRI
OpEx: Pin risk + Charm completion

Maximum Charm flows at the open as overnight time decay forces final dealer rebalancing. Near-expiry options gamma explodes for ATM strikes — creating extreme pin risk. Remaining Vanna exposure collapses as vol sensitivity near zero at expiry. Post-open, price gravitates toward the highest open interest strike (pin).

Vanna & VIX: Understanding Vol-Driven Rallies

The relationship between VIX and Vanna explains some of the most confusing price moves in the market:

VIX Spike Scenario (Vanna Headwind)

When VIX spikes, OTM put deltas increase rapidly. Dealers who sold those puts now have larger delta exposure — they must sell more of the underlying to stay hedged. This is Vanna working against price: higher vol forces more selling, amplifying the initial decline. This is why market selloffs often accelerate once VIX crosses key levels.

VIX Crush Scenario (Vanna Tailwind)

When VIX drops sharply (after a selloff resolves, or post-event), OTM call deltas increase. Dealers holding short calls must buy more underlying. Volatility falling mechanically forces buying — the "V-shaped recovery" is partly a Vanna flow phenomenon. Traders who wait for fundamental catalysts for these moves miss the mechanical driver.

Trading implication: When VIX is elevated and starts to drop, watch for Vanna-driven buying pressure to accelerate a recovery rally — even before any fundamental catalyst appears.
How to Use Vanna & Charm in Practice

Practical applications for futures and equity traders:

  • Pre-Thursday analysis: Check Charm exposure before each Thursday session. A large negative Charm reading means substantial dealer selling at the open. Size down longs or wait for the Charm unwind to complete before entering.
  • VIX watch + Vanna: When VIX drops more than 5% intraday from an elevated level, expect Vanna-driven buying regardless of news flow. This is especially powerful when large OTM call positions exist.
  • Post-selloff recovery timing: After a sharp decline with VIX spike, monitor Vanna exposure to identify when the vol-driven selling will mechanically stop — often a better signal than fundamental analysis.
  • OpEx week strategy: Reduce directional bias and increase mean-reversion bias as Charm flows intensify Thursday/Friday. The mechanical Charm unwind often overrides technical setups.
GEX Metrix Vanna Exposure chart for SPX showing predominantly positive vanna bars by strike

Vanna Exposure ($Bn) — GEX Metrix Pro tier. Predominantly positive (blue) bars indicate dealer vanna is concentrated on the long side across most strikes. A VIX drop from current elevated levels would force significant dealer buying across these strikes — the mechanical driver of "no-catalyst" recovery rallies. Purple dashed = Max Pain.

Vanna vs Gamma: Which Dominates?

In any given market environment, either Gamma or Vanna will be the dominant dealer hedging force:

Gamma dominant (stable vol environment)

When VIX is stable and ATM options dominate positioning, Gamma drives intraday price action. Price orbits gamma walls. Use GEX levels as primary reference points. Vanna adds context but doesn't override gamma structure.

Vanna dominant (volatile environment)

When VIX is moving sharply (>3% daily moves in VIX), Vanna flows can overwhelm Gamma structure. Traditional GEX levels may fail to contain price because dealers are re-hedging for vol changes, not price changes. In these environments, track VIX movement as the primary input.

Rule of thumb: When VIX daily range exceeds 3-4 points, Vanna effects likely dominate. Reduce weight on GEX price levels. When VIX is calm, Gamma levels are more reliable.
Charm Exposure: The Overnight Rebalancing Effect

Charm creates one of the most repeatable patterns in options-driven markets: systematic morning pressure at the open, particularly as expiration approaches.

Why the open often sets the day's direction:
Overnight theta burn changes every dealer's hedge ratio before markets open. When large Charm exposure exists, dealers must execute rebalancing trades at or shortly after the open — creating an early directional push that often defines the session's structure.
GEX Metrix Charm Exposure chart for SPX showing predominantly negative charm bars indicating systematic delta decay selling pressure

Charm Exposure ($Bn) — GEX Metrix Pro tier. Predominantly negative (red) bars indicate large time-decay driven delta erosion as options approach expiration. The concentration of negative charm creates systematic selling pressure at the open on Thursday/Friday — the mechanical "opening flush" that many futures traders mistake for directional price action. Purple dashed = Max Pain.

Practical caution: Don't trade the first 15 minutes of a Thursday/Friday session without checking Charm exposure first. Strong Charm flows in the first hour can create misleading moves that fade once rebalancing completes.