Gamma Levels for Futures Trading

Use options market maker data to trade ES, NQ, RTY, and other index futures with structural price levels you cannot get from charts alone. No options trading required.

Explore Live Gamma Levels →
Why Futures Traders Need Options Data

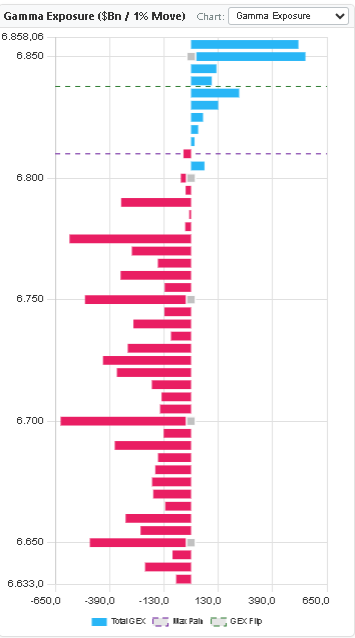
Index futures (ES, NQ, RTY) don't trade in a vacuum. The S&P 500 options market carries over $80 billion in gross gamma. When SPX moves 1%, options market makers must execute billions in offsetting trades in the underlying — which means in ES futures.

This dealer hedging is mechanical and non-discretionary. It follows mathematical rules that don't care about chart patterns, news, or market sentiment. The result: specific price levels where large amounts of automated buying or selling will occur.

Futures traders who ignore this data are competing without knowing where the $80B elephant in the room is going to step next.

The core insight: You don't trade options. But the people who do trade options force dealers to trade futures to hedge. That dealer activity creates the support, resistance, and momentum you see on your ES/NQ chart every day.
Morning Bias: The Most Important Pre-Session Check

Before every futures trading session, check one thing: Is ES/NQ opening above or below the Zero Gamma level?

Opening above Zero Gamma

Dealers are net long gamma. They will sell rallies and buy dips mechanically. Expect a range-bound day with compression. Mean-reversion strategies, fading at gamma walls, and tighter daily ranges. Don't chase breakouts that don't confirm with volume.

Opening below Zero Gamma

Dealers are net short gamma. They will amplify every move — selling into declines, buying into rallies. Expect trending conditions, wider ranges, and momentum continuation. Trend-following and breakout strategies outperform. Avoid mean-reversion.

This one check changes your entire strategy for the day. Many professional futures traders refuse to enter a trade before confirming the gamma regime.
Three Core Gamma Setups for Futures Traders
Setup 1: Gamma Wall Rejection (Fade Trade)

Environment: Positive gamma — price in dealer-stabilized range

Trigger: ES/NQ rallies into a large Call Wall (high positive gamma concentration)

What happens: Dealers must sell futures as price approaches the Call Wall to stay delta-neutral. This creates a ceiling effect that consistently stalls or reverses price.

Trade: Short near Call Wall, target the mid-range or Put Wall. Stop above Call Wall with buffer.

Inverse setup: Long near Put Wall in positive gamma — dealers buy as price drops toward put concentration.

Setup 2: Negative Gamma Breakout (Momentum Trade)

Environment: Price breaks below Zero Gamma level into negative gamma territory

Trigger: ES/NQ closes below Zero Gamma on volume with no immediate recovery

What happens: Dealers flip from stabilizing to amplifying. Every move lower forces more selling. Every rally gets suppressed by fresh dealer hedging. Moves become self-reinforcing.

Trade: Short on retest of Zero Gamma (now resistance), target next Put Wall or structural level below.

Setup 3: Gamma Pinning Near OpEx (Range Trade)

Environment: Large positive gamma concentration at a specific strike, approaching expiration (Thursday/Friday of OpEx week)

Trigger: ES/NQ drifts toward a strike with very high open interest in the nearest expiration

What happens: As expiration approaches, gamma at that strike grows exponentially. Dealers hedge more and more aggressively near the price — creating magnetic attraction that pins price.

Trade: Identify the pin strike before the session. Trade a tight range around it. Use the pin as an anchor for intraday mean-reversion entries.

This setup is most reliable on monthly OpEx Fridays and quarterly expirations.

Combining setups: The most powerful trades combine gamma structure with technical confirmation. A gamma wall rejection that also aligns with a key technical level (VWAP, prior session high) is significantly higher probability than either signal alone.
GEX Metrix: Futures Gamma Dashboard
SPX Underlying Price Chart with GEX structural levels — GEX Flip and Max Pain horizontal lines overlaid on candlestick chart

GEX Metrix — SPX Underlying Price Chart showing key gamma levels as horizontal lines. Green dashed = Max Pain. Gray dashed = GEX Flip (Zero Gamma). When SPX trades below the GEX Flip line, negative gamma conditions amplify directional moves in ES/NQ futures — visible in the sharp Feb-Mar decline.

SPX Gamma Exposure bar chart showing Call Wall and Put Wall levels used by ES futures traders

SPX Gamma Exposure in Split View. The large blue Call Wall concentration at ~6,850 acts as overhead resistance for ES futures. Red put bars below current price define downside support zones. These levels update throughout the session as options flow develops.

Pre-Session Gamma Checklist (5 Minutes)
1
Check Zero Gamma level

Note whether ES/NQ is expected to open above (positive) or below (negative) zero gamma. This sets your bias for the day.

2
Identify nearest Call Wall and Put Wall

These define the expected range for the session. In positive gamma environments, price rarely sustains moves beyond these levels without significant catalyst.

3
Note the High Volatility Level (HVL)

A break through HVL often signals the start of a genuine directional move. Use it as a breakout confirmation filter — don't short a move that pushes through HVL.

4
Check expiration proximity

Are we in OpEx week? Are there large 0DTE positions building? Near-expiry gamma is more powerful and can create sharper reactions at gamma levels.

5
Set your structural levels on the chart

Mark Zero Gamma, Call Wall, and Put Wall on your ES/NQ chart before the open. These are your primary reference lines for the session.

Supported Futures Instruments

GEX Metrix provides gamma exposure analysis for a wide range of instruments. For futures traders, SPX/SPY/QQQ data is most directly relevant to index futures:

Underlying Relevant Futures Data Type
SPX / SPY ES (S&P 500) Full GEX, Delta, Vanna
QQQ / NDX NQ (Nasdaq) Full GEX, Delta, Vanna
IWM / RUT RTY (Russell 2000) GEX, Delta
DIA YM (Dow Jones) GEX
GLD / SLV GC, SI (Metals) GEX
USO CL (Crude Oil) GEX
Most impactful: SPX/ES has the deepest options market and therefore the strongest gamma effects. Start there before expanding to other instruments.
Common Mistakes Futures Traders Make with GEX
  • Ignoring the gamma regime: Using mean-reversion strategies in a negative gamma environment leads to getting stopped out repeatedly as price trends.
  • Stopping at GEX levels, not beyond them: Placing stops exactly at the Call Wall means dealers' hedging activity will trigger your stop before price reverses.
  • Treating GEX as a signal, not a framework: GEX provides structure, not trade signals. You still need a trigger (volume, candlestick, technical confirmation).
  • Ignoring expiration: GEX levels that matter most are from the nearest expiration. Back-month options have less gamma impact intraday.
  • Not updating throughout the day: GEX shifts as options flow develops. Check updated levels at midday, especially around large economic releases.
Gamma Analysis vs Chart Patterns — For Futures Traders

The debate is simple: chart patterns describe what has happened. Gamma levels describe what dealers will be forced to do.

What gamma analysis adds

Pre-defined support/resistance from real positioning data. Volatility regime forecast (range vs trend). Mechanical explanation for why a level held or broke. Forward-looking context that chart history cannot provide.

Practical combination: Use gamma levels to define the structure of the day. Use technical analysis (VWAP, prior session levels, price action) to time your entry within that structure. Neither alone is as powerful as both together.
GEX analysis does not predict every move. When news events or macro data significantly surprise the market, gamma effects can be temporarily overwhelmed. Always use position sizing appropriate to the setup's uncertainty.