Gamma Exposure (GEX) Explained

How $80 billion in options gamma creates predictable support, resistance, and volatility regimes — and how to use it for futures and equity trading

Analyze Live GEX Data →
What is Gamma Exposure (GEX)?

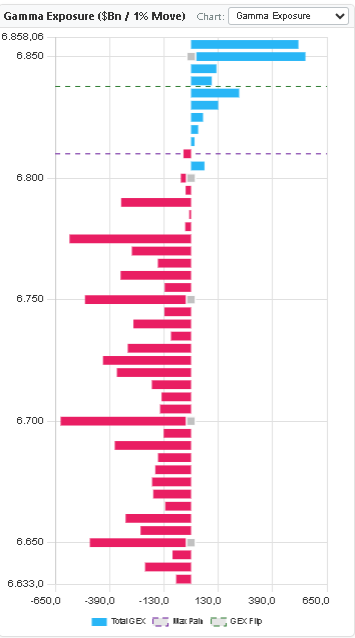
Gamma Exposure (GEX) measures the aggregate gamma that options market makers carry across all strikes and expirations. More precisely, it quantifies how much dealers' total delta changes for every 1% move in the underlying price.

When GEX is high at a specific price level, dealers must execute large buy or sell orders in the underlying to stay delta-neutral. This mechanical hedging is not a choice — it follows mathematical rules. The result is predictable, structural buying and selling pressure at those levels.

The GEX Formula:
GEX = Option Gamma × Open Interest × Contract Size × Spot Price² × 0.01

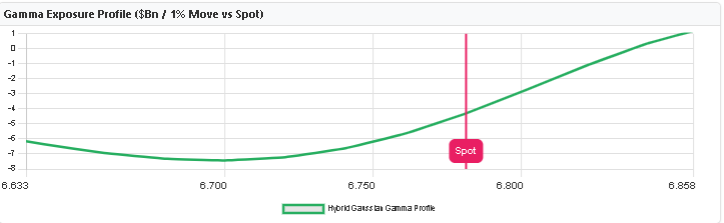
A positive number means dealers are net long gamma (stabilizing). A negative number means dealers are net short gamma (amplifying).
  • Market makers always aim to stay delta-neutral
  • High GEX levels require aggressive hedging activity
  • Hedging flows create magnetism at key price levels
  • GEX sign (+ or −) determines market behavior regime
Positive vs Negative Gamma Environment

🟢 Positive Gamma Environment

Dealers are net long gamma (bought calls / sold puts)
  • • Price drops → dealers buy the underlying (creates support)
  • • Price rises → dealers sell the underlying (creates resistance)
  • • Effect: Range-bound, compressed volatility, mean-reverting
  • • Strategy edge: Fade extremes, sell breakouts

🔴 Negative Gamma Environment

Dealers are net short gamma (sold calls / bought puts)
  • • Price drops → dealers sell the underlying (accelerates decline)
  • • Price rises → dealers buy the underlying (accelerates rally)
  • • Effect: Trending, volatile, momentum-driven
  • • Strategy edge: Follow momentum, use wider stops
Key GEX Price Levels Every Trader Should Know

These structural levels emerge from GEX analysis and act as high-probability reference points for support, resistance, and regime change.

⚖️ Zero Gamma Level (Gamma Flip)

The price where total dealer gamma crosses from positive to negative. Above = stabilizing regime. Below = amplifying regime. This is the single most important structural level for session planning. Many experienced traders determine their entire directional bias for the day based on whether price opens above or below zero gamma.

📞 Call Wall

The strike with the highest concentration of call gamma. As price approaches the Call Wall, dealers must sell the underlying to hedge — creating strong overhead resistance. The Call Wall often acts as the upper boundary of the expected daily range in positive gamma environments.

📉 Put Wall

The strike with the highest concentration of put gamma. As price approaches the Put Wall, dealers must buy the underlying to hedge — creating strong downside support. In positive gamma, the Put Wall and Call Wall together define the "gamma band" where price tends to pin.

⚡ High Volatility Level (HVL)

A structural level where, if breached, dealer hedging flows are projected to create accelerated directional movement. Breaking through the HVL is often a confirmation signal for a genuine trend day rather than a temporary probe. Widely used by futures traders for breakout confirmation.

GEX Chart in GEX Metrix
GEX Metrix SPX Gamma Exposure chart in Split View showing call gamma (blue) and put gamma (red) bars by strike with Max Pain and GEX Flip levels

GEX Metrix — SPX Gamma Exposure (Split View). Blue bars = positive call gamma. Red bars = put gamma. The large blue bar at ~6,850 is the Call Wall. Green dashed = Max Pain. Gray dashed = GEX Flip (Zero Gamma level).

GEX Metrix Gamma Exposure Profile showing Hybrid Gaussian curve with current Spot price marked

Gamma Exposure Profile — the green curve shows simulated gamma exposure across the full price range. The pink Spot line marks current SPX price. Values below zero indicate negative gamma at current levels — trending conditions expected.

GEX Market Impact Simulator

Model how market maker hedging affects price based on GEX environment and magnitude:

GEX Trading Scenarios

Scenario 1: Positive Gamma Support

Setup: ES at 5520, large call gamma at 5500

Price moves: ES drops toward 5500

MM Response: Buy ES futures to hedge calls → support created

Trade idea: Look for long entries near 5500 with tight stops below

Scenario 2: Negative Gamma Acceleration

Setup: ES at 5480, price below zero gamma at 5500

Price moves: ES breaks below 5480 on volume

MM Response: Sell ES to re-hedge puts → decline accelerates

Trade idea: Follow momentum, targets at next put wall below

Scenario 3: Call Wall Rejection

Setup: ES rallies into 5600 Call Wall

Price moves: ES approaches 5600 intraday

MM Response: Sell ES to hedge calls → overhead resistance

Trade idea: Short-term fade with stop above Call Wall

Reading GEX Charts: What to Look For

Key indicators in any GEX chart:

  • Bar magnitude: Larger bars = stronger dealer hedging at that strike
  • Bar color: Green = positive gamma (stabilizing), Red = negative gamma (amplifying)
  • Strike concentration: Few large bars = strong pin risk. Many bars = wider range
  • Zero line crossings: Where cumulative GEX changes sign — the most critical level
  • Expiration weighting: Near-expiry options have higher gamma per dollar of OI
  • Volume vs OI: Rising volume at a strike means GEX is actively building
Important: GEX effects are strongest during regular market hours when market makers are actively hedging. Pre-market and after-hours moves often don't respect GEX levels because dealer flows are absent.
Factors That Amplify GEX Impact
  • High open interest concentration: More contracts = more hedging required per move
  • Near expiration: Gamma peaks as options approach expiry — OPEX weeks are most powerful
  • Low market liquidity: Dealer hedges move price more when liquidity is thin
  • Large institutional positioning: Coordinated flow amplifies directional hedging pressure
  • VIX expansion: Rising volatility causes dealers to re-hedge more aggressively
Pro tip: The most reliable GEX levels cluster at round numbers (5400, 5500, 5600 for SPX) where retail and institutional options activity naturally concentrates.
Combining GEX with Your Trading Style

GEX is a structural layer — it works with any trading approach:

For intraday traders (ES/NQ futures): Use zero gamma level as morning bias indicator. Trade with the structure — fade at call walls in positive gamma, follow momentum in negative gamma.
For swing traders: Identify the weekly GEX regime. Positive gamma weeks favor range strategies. Negative gamma weeks — especially into OpEx — favor directional setups.
For risk management: Place stops beyond significant GEX levels, not at them. A stop right at the call wall will get hit by dealer hedging before price reverses.