Options Greeks: The Market's Hidden Price Roadmap

Gamma, Delta, Vanna & Charm expose where $80 billion in market maker hedging creates real support, resistance, and momentum — in futures and equity markets alike. No options trading required.

Explore Live GEX Data →
What Are Options Greeks — And Why Should Non-Options Traders Care?

Options Greeks (Gamma, Delta, Vanna, Charm) measure how options change in value as the market moves. But their real power for directional traders is different: they reveal where market makers are mechanically forced to buy and sell the underlying asset.

Market makers who sell options must continuously hedge their exposure by trading the underlying — stocks, ETFs, or futures. This hedging is not discretionary. It follows mathematical rules. The result: predictable buying and selling pressure at specific price levels that show up as support, resistance, and volatility shifts on your chart.

  • Gamma — where dealers must hedge the most aggressively
  • Delta — the directional bias embedded in current positioning
  • Vanna — how a VIX move forces dealers to rebalance
  • Charm — how time decay erodes dealer hedges each day
Built for Futures & Directional Traders

Most GEX tools are built for options traders analyzing spreads and premium. GEX Metrix takes a different approach — designed for traders who want directional edge in futures (ES, NQ, RTY) and equity markets without touching a single options contract.

✅ What you get without trading options

Structural price levels derived from real options positioning. Know before the open whether ES is likely to pin in a range or break into trend. See which levels have $1B+ in dealer hedging behind them.

❌ What competitors focus on instead

Complex options strategies, premium selling setups, iron condors. Useful for options traders — but irrelevant if you just want to know where ES/NQ will find support or blow through resistance today.

Options Market Scale — Why This Data Moves Futures
$80B+
Gross gamma in S&P 500 options
50%+
SPX daily volume from 0DTE options
78%
Days SPX closes inside GEX-predicted range
600+
Instruments tracked on GEX Metrix

When $80 billion in gamma needs to be re-hedged on a 1% price move, that hedging is the market structure you see on your chart.

GEX Metrix Dashboard — Live Options Flow Analysis
GEX Metrix Dashboard showing SPX gamma exposure, price chart, volume, history and gamma profile with expiration date range selector open

GEX Metrix — full dashboard for SPX (S&P 500). Left: SPX price chart with GEX Flip (Zero Gamma) and Max Pain levels overlaid. Center: Gamma Exposure bars by strike in Split View. Right: Volume by strike. Bottom: Gamma History and Gamma Profile. The Expiration Date Range selector (open) allows switching between 0 DTE, weekly, monthly and custom timeframes — giving a complete picture of dealer positioning at every horizon.

How to Use GEX Metrix in 3 Steps
Step 1 — Open the dashboard before the trading session
Check the current GEX profile for your instrument. Identify the zero gamma level, the nearest Call Wall (resistance), and the nearest Put Wall (support).
Step 2 — Classify the environment
Are you above or below the zero gamma level? Positive gamma = range-bound day likely. Negative gamma = trending day likely. This one decision changes your entire strategy for the day.
Step 3 — Set levels, not guesses
Use gamma walls as structural entries, exits, and stop levels. Price approaching a $2B+ gamma wall behaves differently from price in open air. Trade that difference.
Gamma vs Traditional Technical Analysis

Technical analysis draws lines on price history. GEX analysis reveals where dealers are structurally obligated to act — regardless of what the chart looks like.

Traditional TA GEX Analysis
Based on past price action Based on current positioning
Levels drawn subjectively Levels calculated from real OI
Can't predict volatility regime Predicts range vs trending day
Doesn't update intraday Updates with options flow
Best approach: Use GEX levels as the primary structure, technical analysis as the entry trigger.
Frequently Asked Questions
What is gamma exposure (GEX)? +
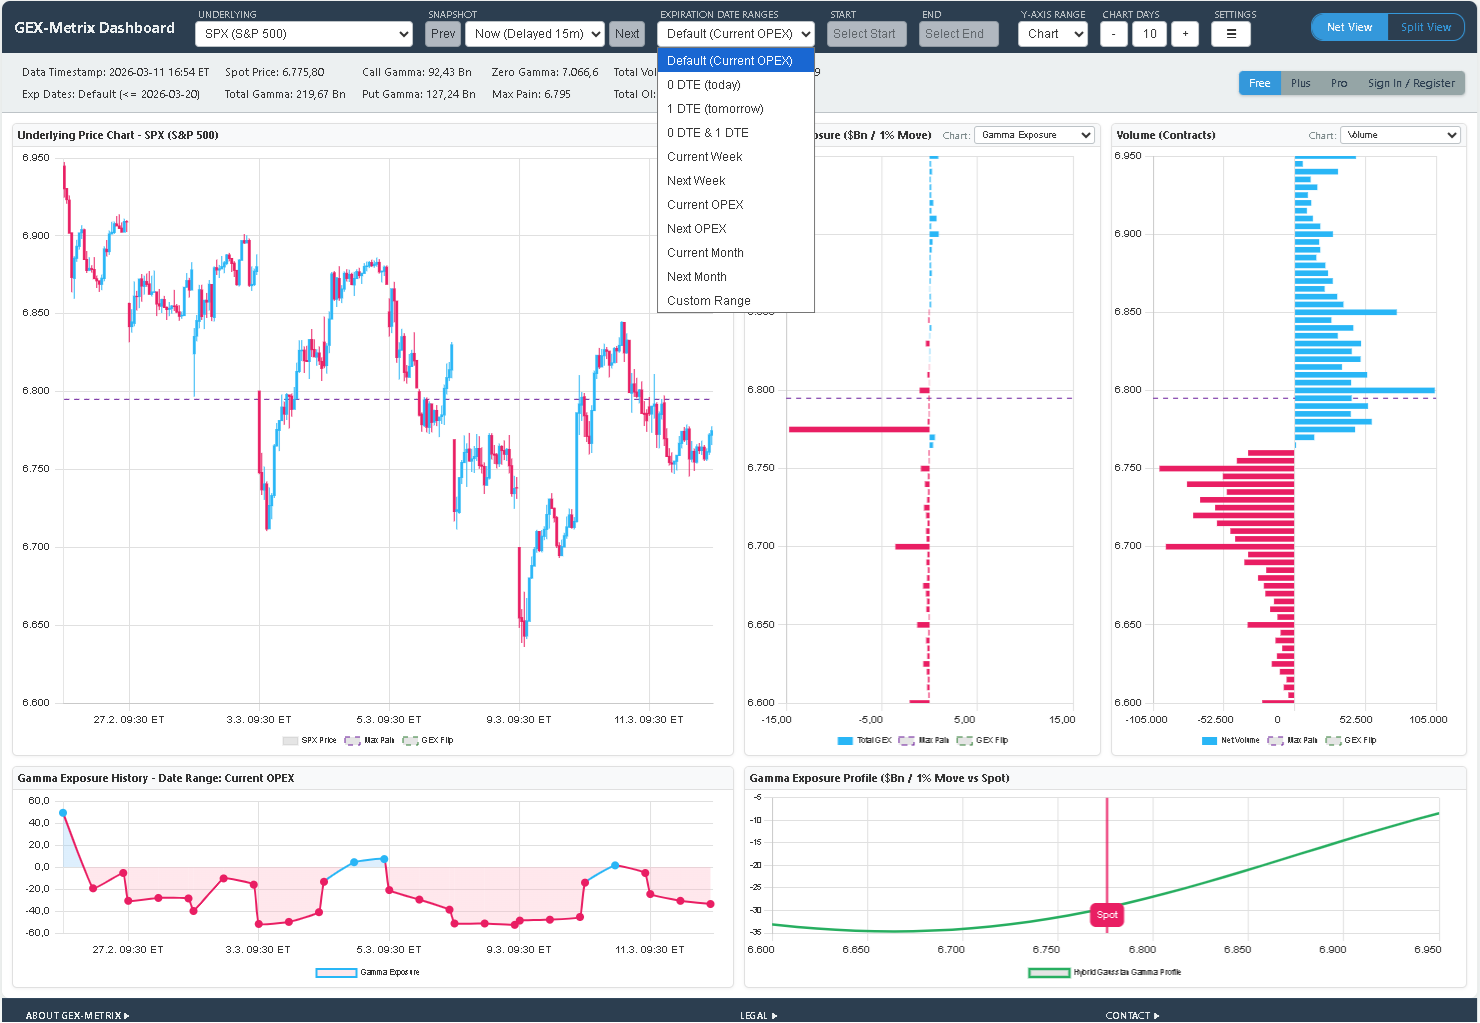
Gamma exposure (GEX) measures how much market makers' collective delta changes for every 1% move in the underlying. High gamma at a price level means dealers must buy or sell large amounts of the underlying to stay hedged — creating predictable support, resistance, and volatility compression or expansion at that level.
Do I need to trade options to benefit from GEX data? +
No — and this is the most important point. GEX data is arguably more valuable for futures and directional equity traders than for options traders themselves. Market maker hedging flows directly impact the price of ES, NQ, SPY, and other underlying instruments. Understanding those flows gives you structural price levels that pure technical analysis cannot provide.
What is the zero gamma level and why does it matter? +
The zero gamma level is where total dealer gamma exposure flips from positive to negative. Above it, dealers act as stabilizers — buying dips and selling rallies. Below it, dealers act as amplifiers — selling into declines and buying into rallies. This single level determines whether the day is likely to be a range day or a trending day. Many traders use it as the most important morning reference point.
How do futures traders specifically use gamma levels? +
Futures traders use gamma levels in several ways: (1) Gamma walls as high-probability fade levels when in positive gamma territory. (2) Gamma flip zones as breakout triggers — a clean break through the zero gamma level often signals a directional move. (3) Negative gamma zones where momentum strategies outperform mean-reversion strategies. (4) Pre-session bias — knowing whether ES is opening in positive or negative gamma territory shapes the entire trading plan for the day.
What is a gamma squeeze? +
A gamma squeeze happens when aggressive call buying forces market makers to buy the underlying to hedge. As price rises from their buying, more out-of-the-money calls come in range, requiring even more buying — a self-reinforcing cycle. GEX data shows the gamma buildup before the squeeze becomes obvious in price action.
How often does GEX Metrix update its data? +
GEX Metrix collects fresh options data throughout the trading session, with snapshots available every 15 minutes during market hours. Historical snapshots allow you to compare current positioning against prior sessions to see how the GEX landscape has shifted.